
Understanding Solar Panel Voltage Fundamentals
Somewhere in the Karoo, a single solar panel sits under a brutal sun. Its voltage climbs and falls with the heat, reaching for numbers that will never appear in the brochure. Most owners never look at these numbers until something stops working!
The solar panel voltage chart tells the truth about your system. It shows how much power you can expect from a panel rated at 40 volts and why that number shifts with temperature, wiring length, and the depth of your battery bank’s charge. A solar panel voltage chart is not a marketing document. It is an honest record of what your panels will do under real conditions.
I once watched a man replace three charge controllers before realising his panel was delivering more voltage than the controller could handle. That chart would have shown him the problem in seconds.
How to Interpret a Voltage Reference Chart
South African sunlight is a brute. A solar panel voltage chart reads its temper. You look at open circuit voltage and you see the panel at rest. Then you look at working voltage, the real number under load. The space between those figures is where problems hide. Voltage drop on a hot inland afternoon can be dramatic.
It is useful to track three values on every chart:
- Open circuit voltage.
- Voltage at maximum power.
- Nominal system voltage.
Each one answers a different question. This is where the solar panel voltage chart earns its keep. It becomes a weather report for your installation, describing when panels run hot, tired, or operating clean. A cloudy day shifts the numbers gently. The grid’s own variation adds another twist. Reading the chart against those moving conditions reveals the true health of your system.
Voltage Ranges for Different Solar Configurations
The solar conversation in South Africa has shifted from curiosity to necessity. As load-shedding persists, homeowners and businesses alike are scrutinising every component of their energy systems. At the heart of this exploration lies the solar panel voltage chart, a reference that bridges the gap between raw sunlight and usable electricity.
Off-grid systems speak in voltage dialects. A 12V configuration often powers small cabins and tiny homes, delivering simplicity at the cost of higher current. Most residential installations, however, gravitate toward a 24V architecture, striking a balance between efficiency and component cost. For sprawling estates or commercial operations, 48V systems dominate, reducing cable thickness and taming transmission losses.
– 12V: Ideal for a single panel, battery, and minimal lighting loads.
– 24V: The workhorse for typical South African households with fridges and inverters.
– 48V: Reserved for high-consumption environments, often paired with hybrid inverters.
The physical law is simple. Doubling the voltage halves the current for the same power output. This is why larger systems climb the ladder. A solar panel voltage chart makes this relationship tangible, allowing you to match panels, batteries, and inverters without guesswork. Read it carefully, because the numbers dictate the harmony of your entire setup.
Applying Voltage Data to Real World Solar Installations
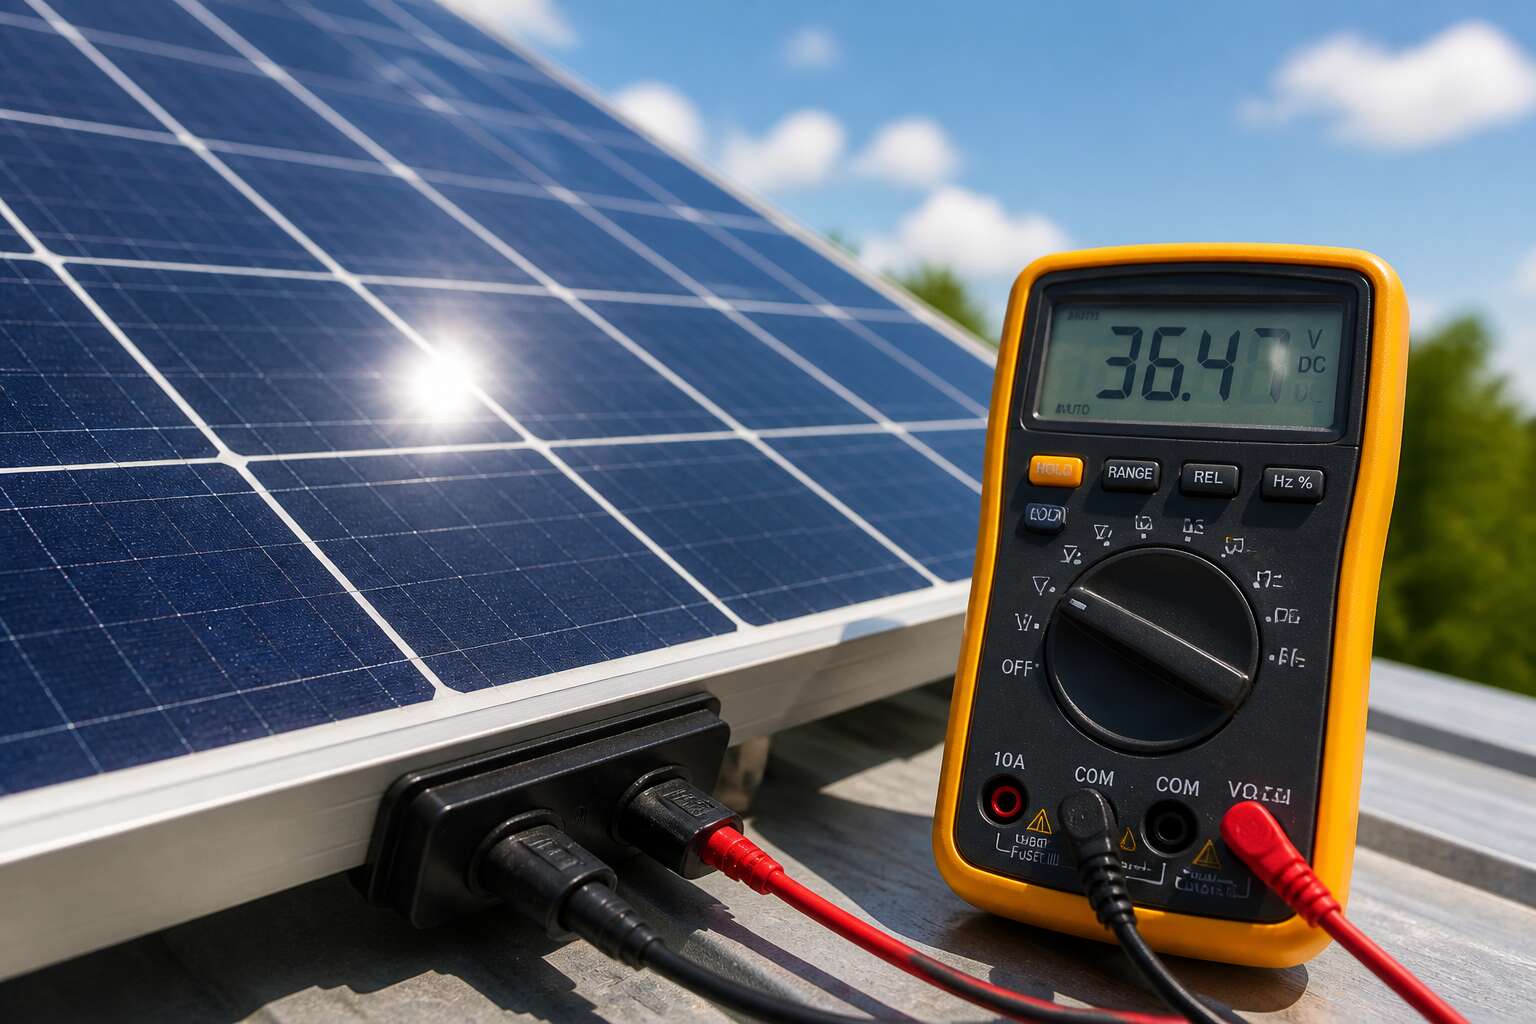
Open circuit voltage tells you everything before the sun even rises. The solar panel voltage chart is the reference point. In South Africa, where irradiance varies from Cape Town’s winter grey to the Karoo’s summer glare, voltage readings vary noticeably. You cannot simply wire panels and hope.
The morning cold stiffens your fingers as you clip the multimeter leads. Those open circuit values stare back at you. They confirm what the chart promised. Then the load kicks in and reality adjusts itself.
Consider the placement factors:
- Orientation toward true north
- Tilt angle against the equinox
- Shading from that neighbour’s growing acacia
Each variable bends the voltage curve. The chart gives you the baseline. The site gives you the truth.
Avoiding Common Mistakes With Solar Voltage Specifications
Most installers glance at a solar panel voltage chart once and then file it away. That is a mistake. In South Africa, where midday heat pushes panel temperatures past 60°C, the voltage your array produces in the real world differs sharply from the lab spec.
People routinely confuse Voc and Vmp. I have watched it happen far too often. Open circuit voltage is what you measure with no load. Vmp is what your charge controller actually works with. Reading the wrong column on the solar panel voltage chart leads to undersized controllers and damaged electronics. Temperature coefficients matter too. Every panel loses voltage as it heats up. The chart lists this, but only if you read the fine print.
- Confusing Voc with Vmp when calculating string length.
- Ignoring the temperature coefficient in high heat.
- Mixing panels with different voltage ratings in one string.
Trusting the numbers without context is how fires start.


0 Comments